
NapkinAIってなに?
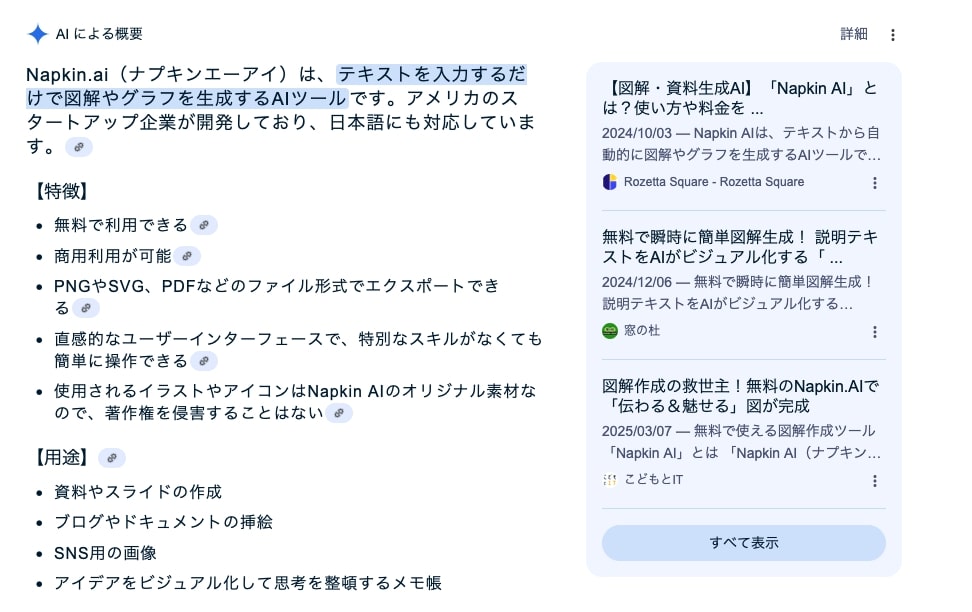
NapkinAIは、文章から図解、グラフなどを作成するAIです。文章もAIで作成することもできます。2025年3月18日時点では無料で使えます。
Googleで検索した結果です(Google検索でもAIで結果をまとめてくれます)。
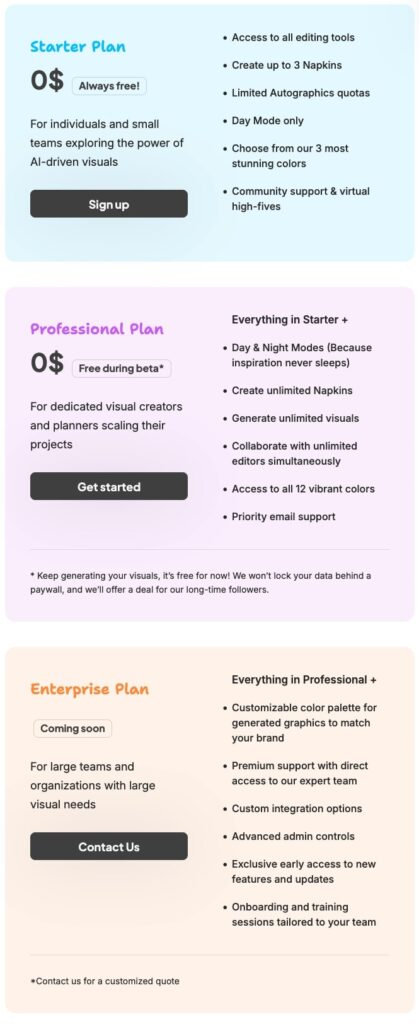
NapkinAIの価格
無料アカウントもありますが、価格表にあるとおりベータ版の間はProプランも無料です。
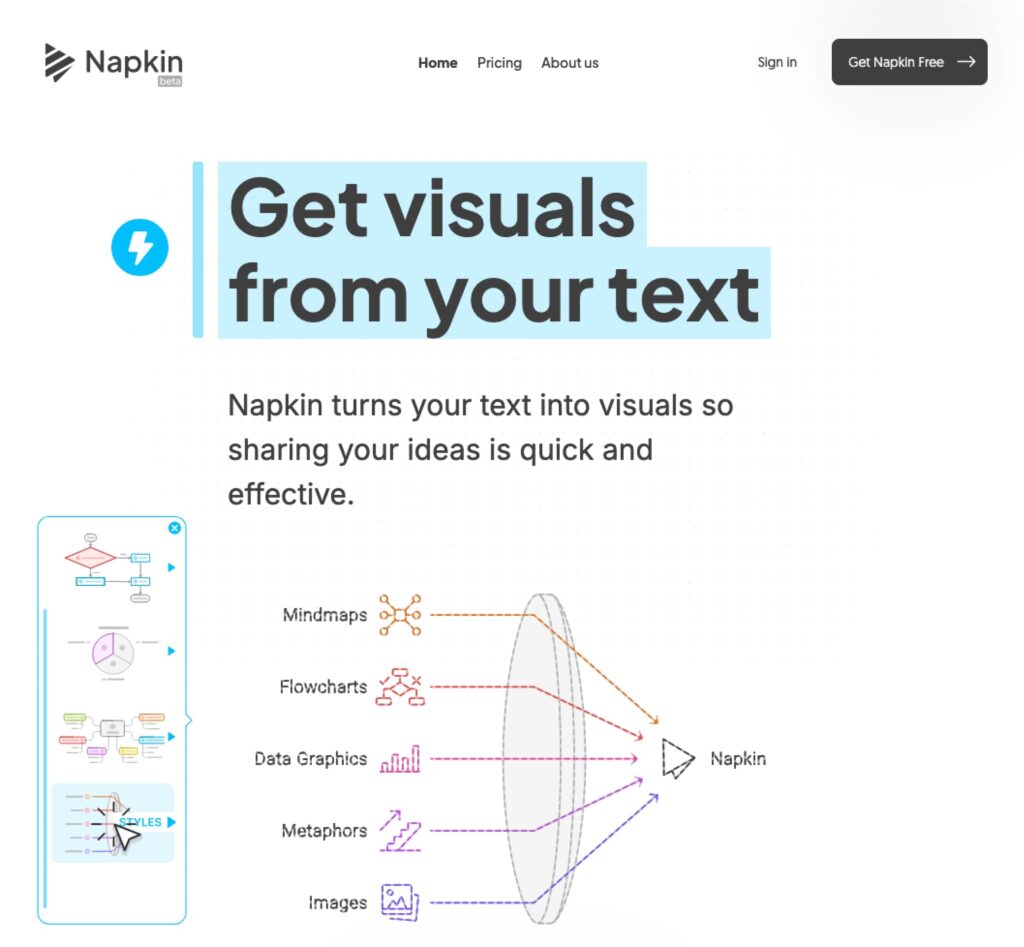
NapkinAIでのアカウント作成
NapkinAIを使うためにアカウントを作成します。
トップページにアクセスし、「Get Napkin Free」をクリックします。
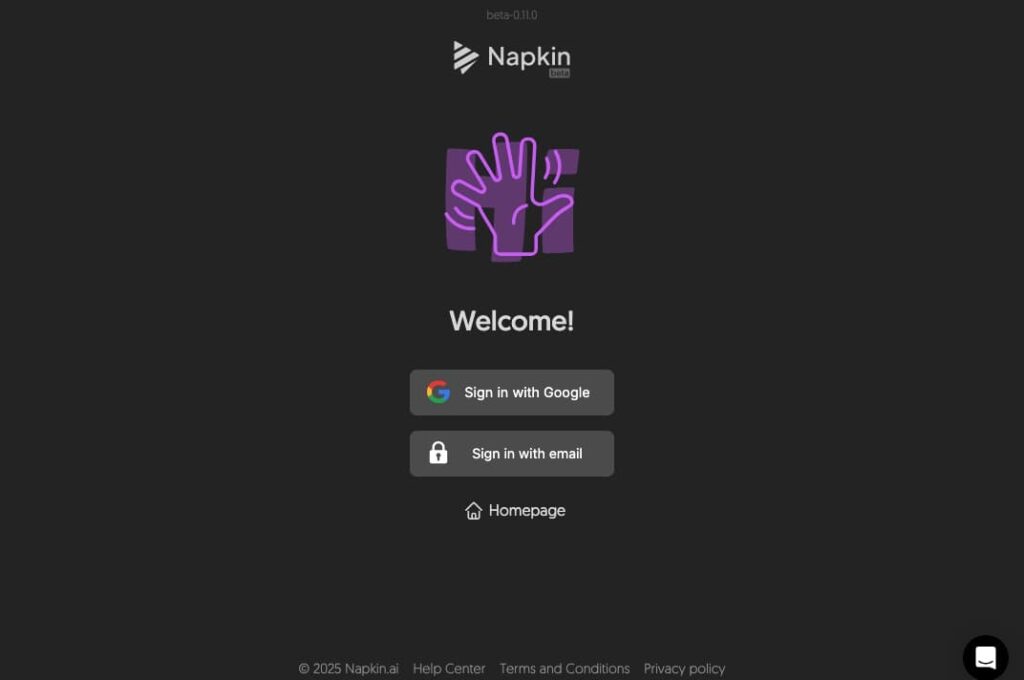
サインイン画面に変わります。今回はGoogleアカウントでNapkinアカウントを作成します。「Sign in with Google」をクリックします。
Google認証が完了しますとアンケート的な質問が続きます。
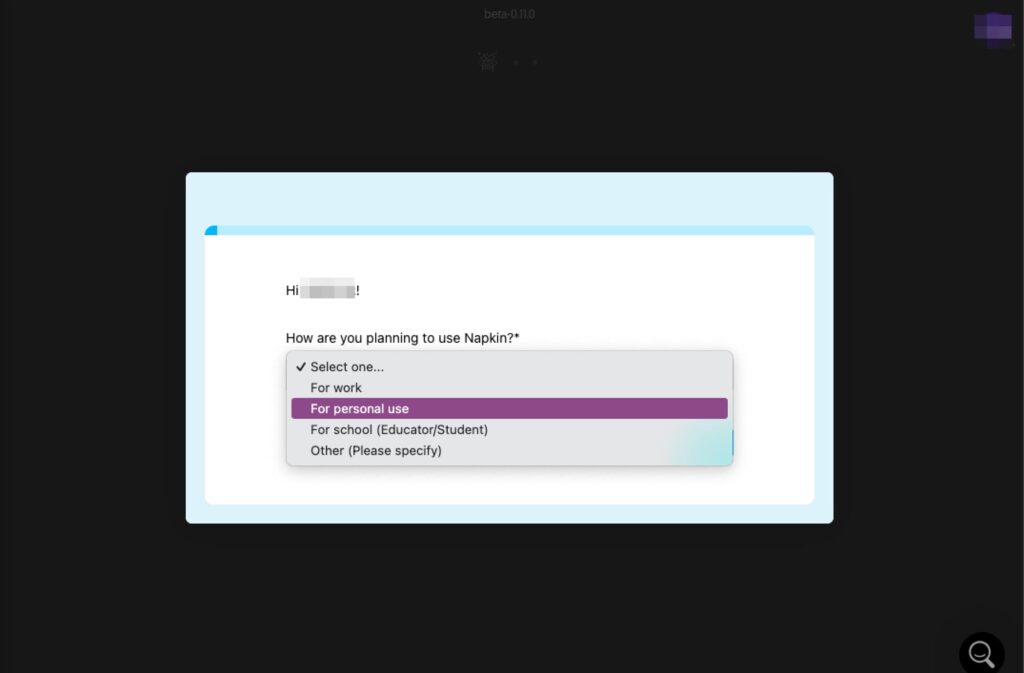
「Napkinの使用目的はなんですか?(How are you planning to use Napkin?)」
- 仕事用(For work)
- 個人利用(For personal use)
- 学校(教育者/学生)(For school(Educator/Student))
- その他(詳しく)
から選択します。
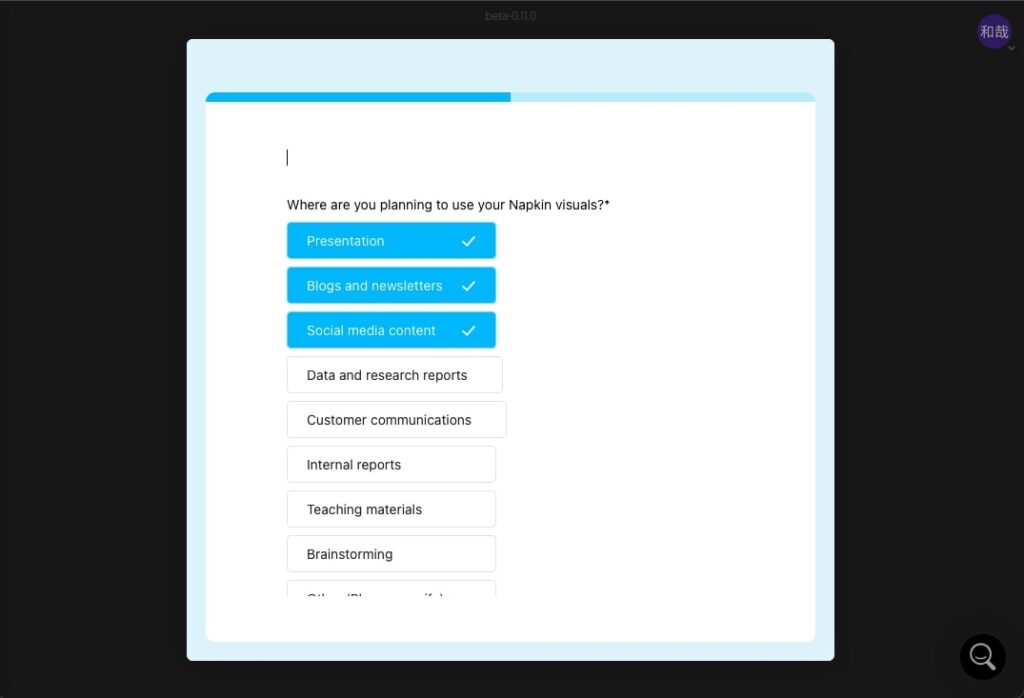
「どこでNapkinの生成物を使用しますか?(Where are you planning to use your Napkin visuals?)」
- Presentation(プレゼン)
- Blog and newsletters(ブログやメルマガ)
- Social media content(SNSの投稿)
- Data and research report(データ、研究レポート)
- Customer communications(顧客との連絡)
- Internal reports(内部でのレポート)
- Teaching materials(教育素材)
- Brainstorming(ブレインストーミング)
- Other(その他)
から該当するモノを全て選択し「Submit(送信)」ボタンをクリックします。
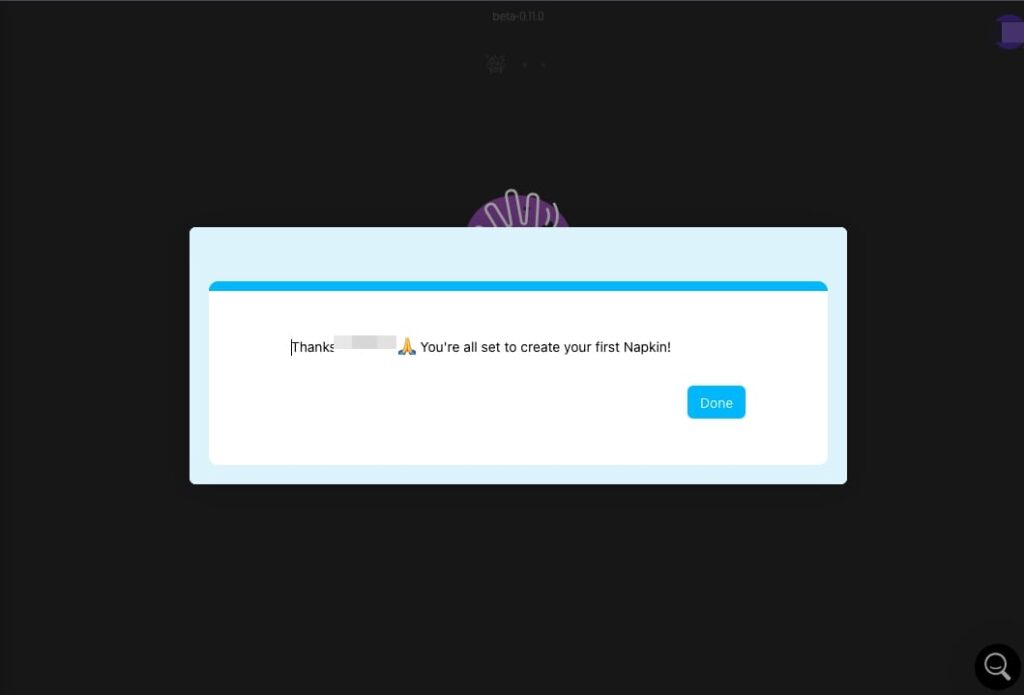
アカウント作成完了の画面になります。「Done(完了)」ボタンをクリックします。
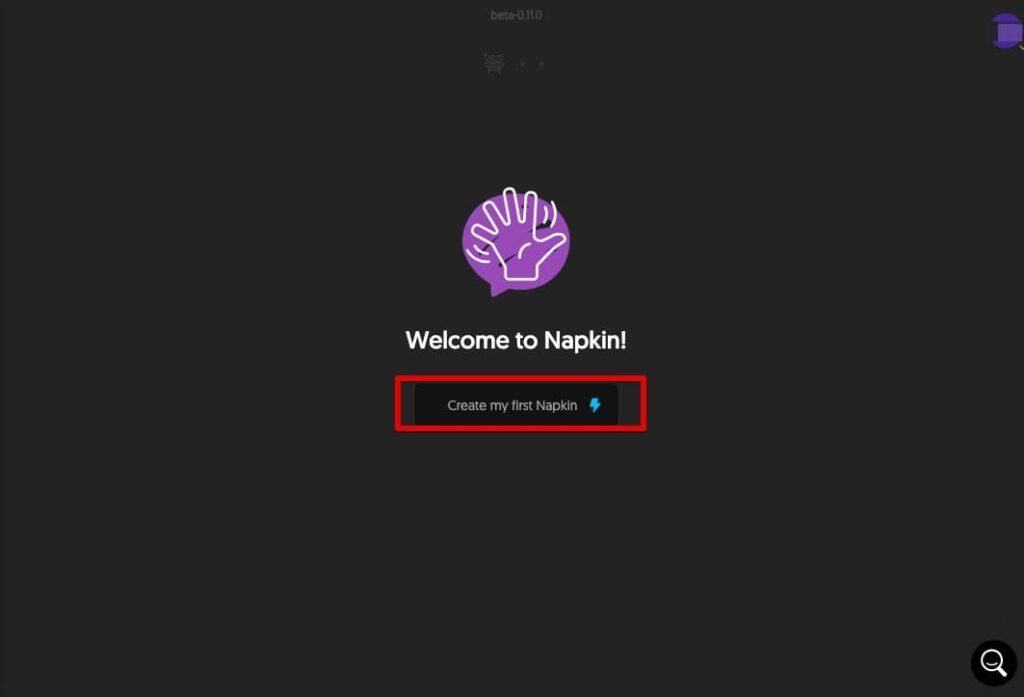
ようこそ画面が表示されます。
「Create my first Napkin(最初のNapkinを作成)」をクリックします。
図解、グラフを作成する。
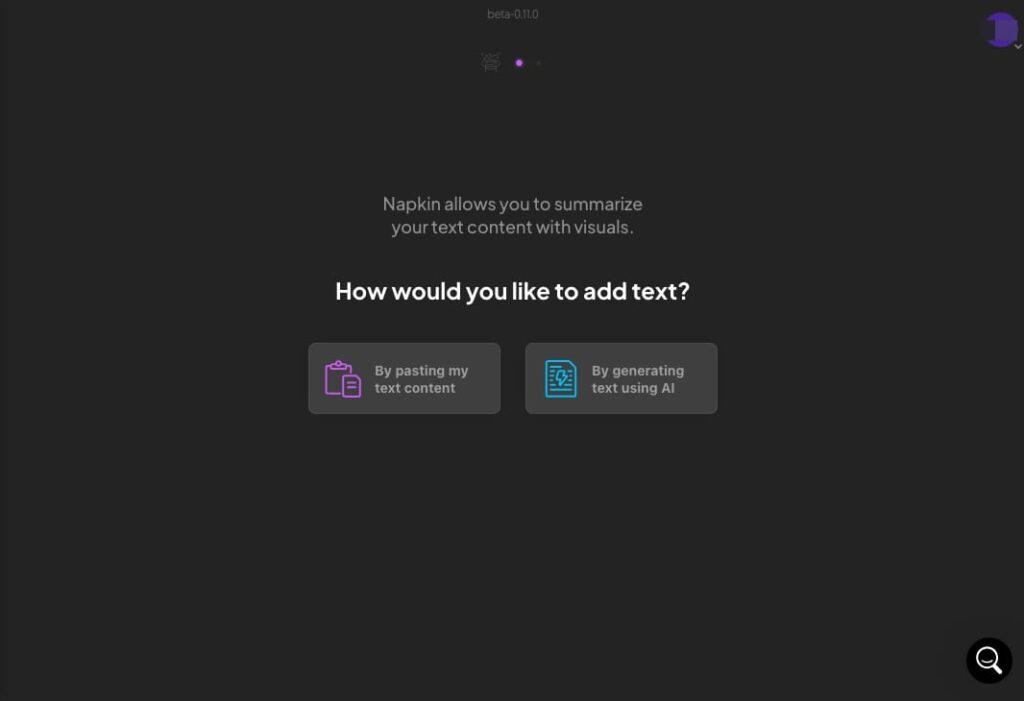
最初は図解やグラフの元になる文章をどうするかを尋ねられます。
- コピペ(By pasting my text content)
- AIを使って文章作成(By Generationg text using AI)
から選択します。
今回は「コピペ」を選択します。
タイトルを入力し、文章を貼り付けます。
「Generate Visual」ボタンをクリックします。
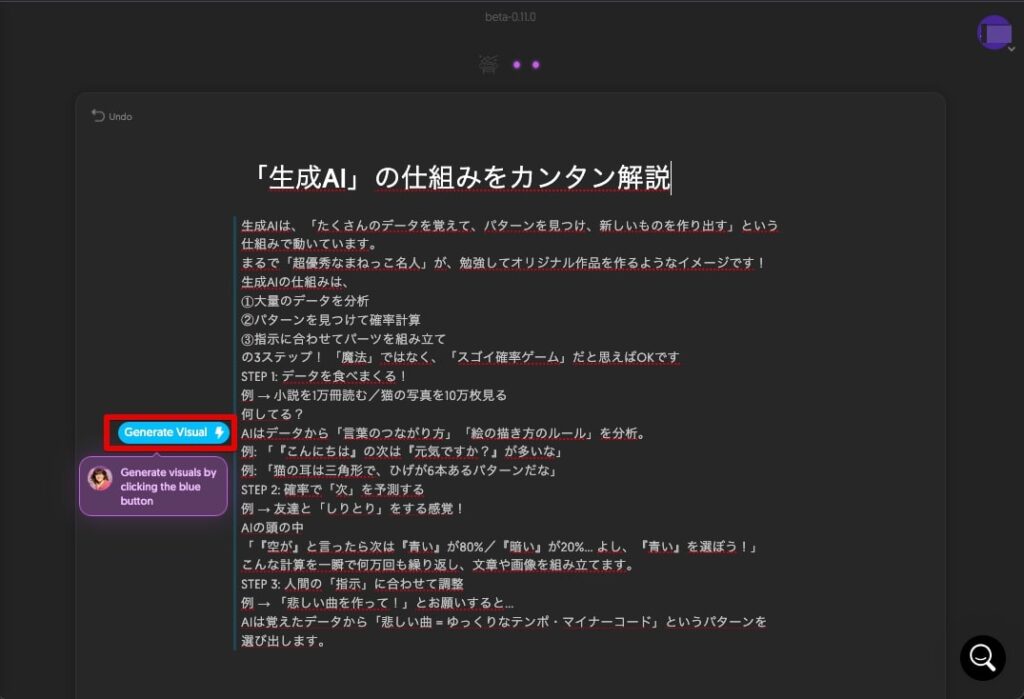
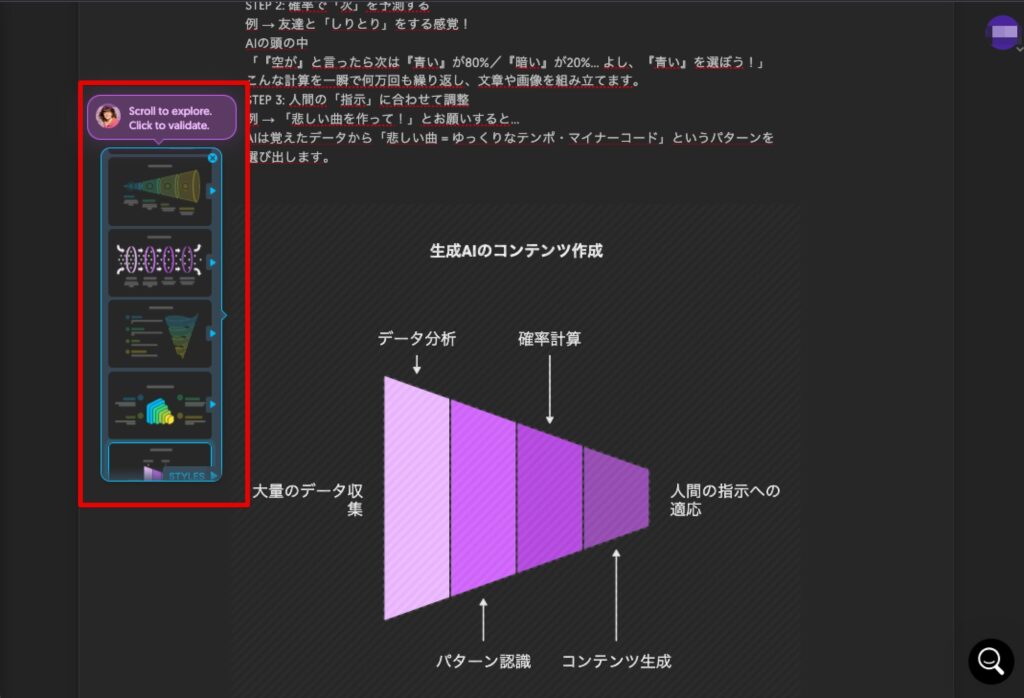
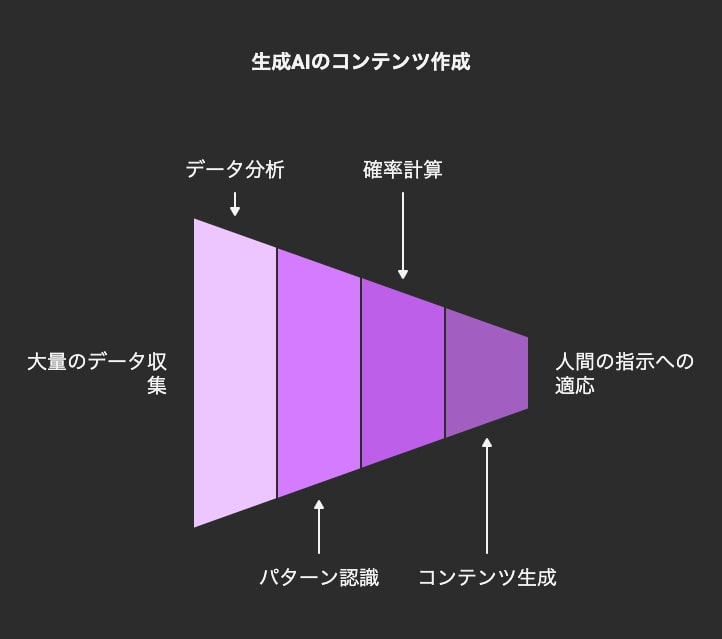
文章から図解が作成されます。
左側の赤枠を縦にスクロースするといろいろなタイプの図解を選択することができます。また、各図解の右橫矢印をクリックすると色やスタイルを選択することができます。
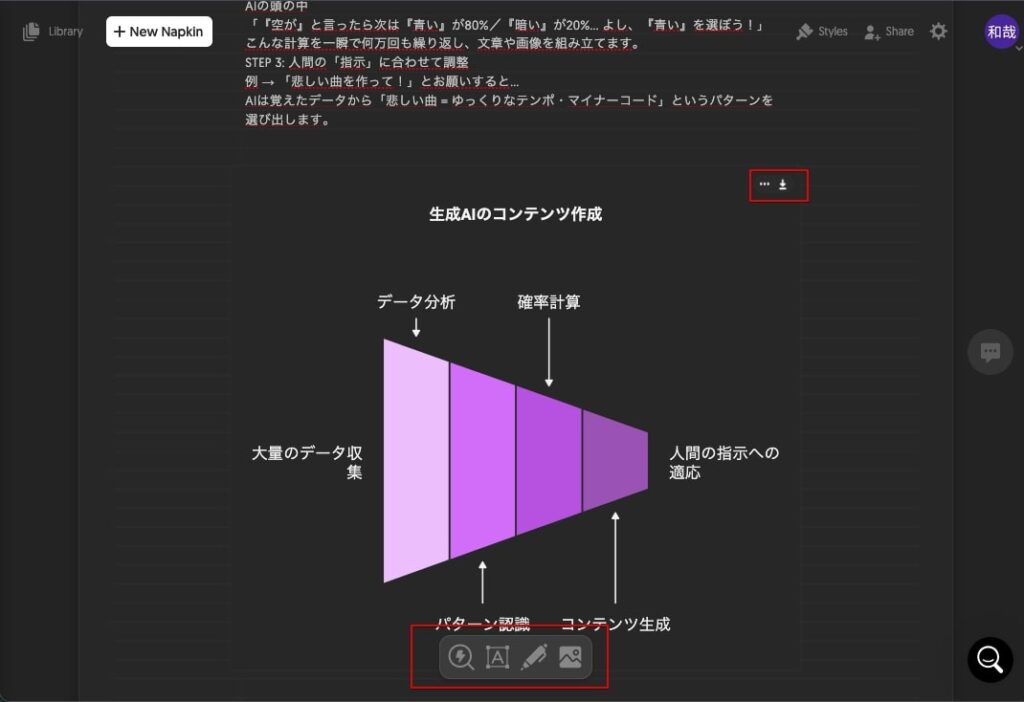
図解を選択すると、選択した図解を編集することができます。
また、図解の右上にはダウンロードボタンもあります。
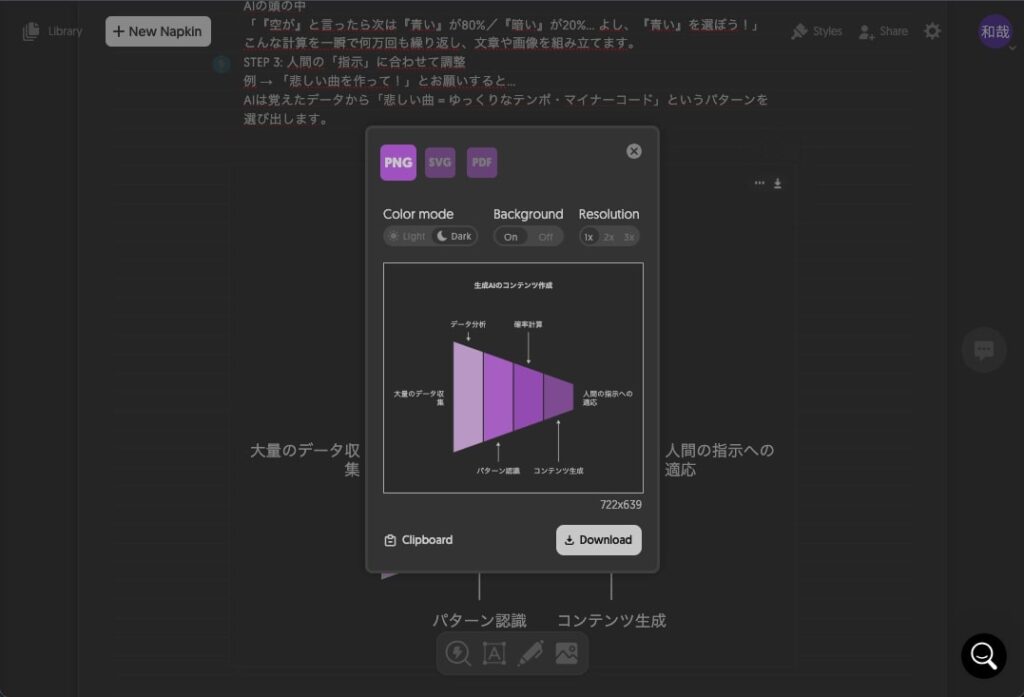
ダウンロードをクリックすると、出力形式を尋ねられます。
- PNG画像
- SVG画像
でのダウンロードが可能です。
PNGを選択し「Download」ボタンをクリックします。
以下が作成した画像です。
生成物の管理
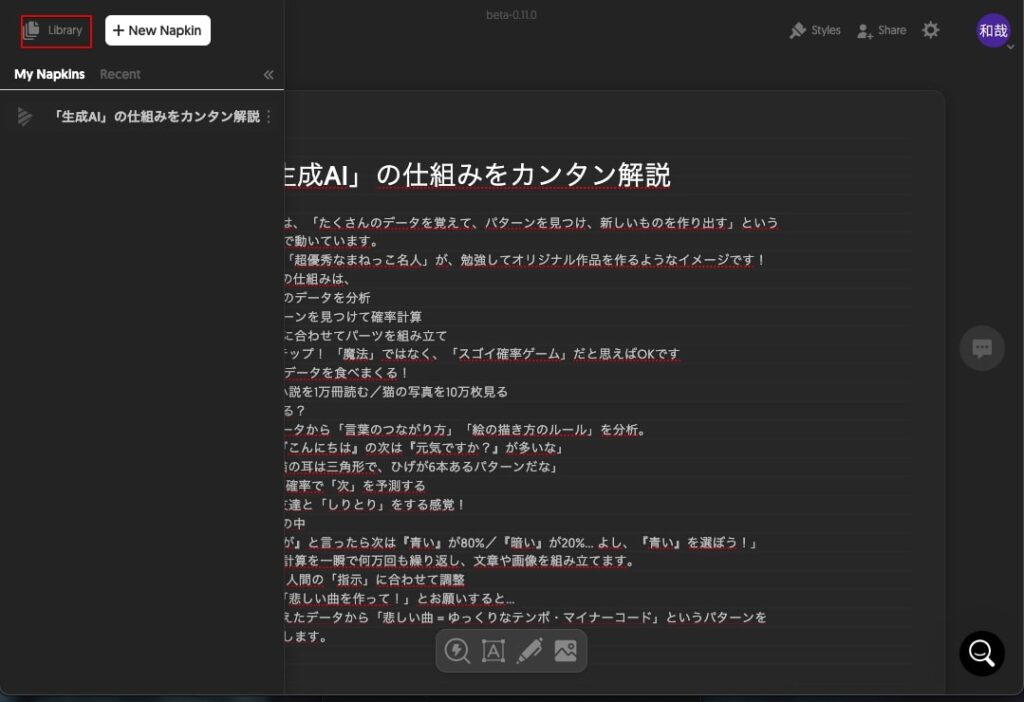
NapkinAIの画面はシンプルです。
左側上部の「Library」ボタンをクリックすると作成済みのものがリスト表示されます。
「+New Napkin」ボタンをクリックすると新規の図解作成画面になります。
まとめ
文章だけの説明よりも図解があるだけで理解度が上がります。また、図解があると目にとまりやすくなります。
Cacoo、Canvaなどオンラインで図解作成ツールはありますが、テキストを挿入したりの手間がないため、NapkinAIで作成するのは非常にカンタンです。


コメント